TradeLab
Home
Indicators
Learn
News
Analyze
Login
🔒 Use My Private Indicator
🌐Common Indicator for all Markets
//@version=5 indicator("OG Algo for all markets", overlay=true) // strategy("OG Algo Strategy Tester", overlay=true, default_qty_type=strategy.percent_of_equity,default_qty_value=300, initial_capital=20000) ema1_length = input.int(9, title="EMA 1 Length", minval=1) ema2_length = input.int(15, title="EMA 2 Length", minval=1) ema3_length = input.int(34, title="EMA 3 Length", minval=1) user_ema1 = ta.ema(close, ema1_length) user_ema2 = ta.ema(close, ema2_length) user_ema3 = ta.ema(close, ema3_length) // Define the EMAs ema9 = ta.ema(close, 9) ema15 = ta.ema(close, 15) trend_length = 10 // Number of bars to check for trend confirmation // Initialize Bullish & Bearish Pattern Counters var int bullish_count = 0 var int bearish_count = 0 // Define Bullish & Bearish Candlestick Patterns bullish_engulfing = close > open and open[1] > close[1] and close > open[1] morning_star = close[2] < open[2] and close[1] < open[1] and close > open and close > close[2] bullish_pin_bar = close > open and (high - math.max(open, close)) > 2 * (open - close) and (math.min(open, close) - low) > 2 * (open - close) bearish_engulfing = open > close and close[1] > open[1] and close < open[1] evening_star = close[2] > open[2] and close[1] > open[1] and close < open and close < close[2] bearish_pin_bar = open > close and (high - math.max(open, close)) > 2 * (open - close) and (math.min(open, close) - low) > 2 * (open - close) // Count Bullish Patterns Over Last N Bars bullish_count := 0 for i = 0 to trend_length - 1 if bullish_engulfing[i] or morning_star[i] or bullish_pin_bar[i] bullish_count := bullish_count + 1 // Count Bearish Patterns Over Last N Bars bearish_count := 0 for i = 0 to trend_length - 1 if bearish_engulfing[i] or evening_star[i] or bearish_pin_bar[i] bearish_count := bearish_count + 1 // Minimum number of bullish/bearish patterns needed to confirm a trend min_bullish_count = 3 min_bearish_count = 3 // Define Uptrend & Downtrend (Replacing Slope-Based Trend Condition) uptrend = ema9 > ema15 and bullish_count >= min_bullish_count downtrend = ema9 < ema15 and bearish_count >= min_bearish_count // Define Bullish and Bearish Candles bullish_candle = close > open bearish_candle = close < open // Higher High & Higher Low (Uptrend) higher_high = high > high[1] and high[1] > high[2] higher_low = low > low[1] and low[1] > low[2] // Lower High & Lower Low (Downtrend) lower_high = high < high[1] and high[1] < high[2] lower_low = low < low[1] and low[1] < low[2] // Buy signal when market forms HH & HL + bullish trend + bullish candle (Only in Uptrend) buy_signal_from_hh_hl = uptrend and higher_high and higher_low and bullish_candle // Sell signal when market forms LH & LL + bearish trend + bearish candle (Only in Downtrend) sell_signal_from_lh_ll = downtrend and lower_high and lower_low and bearish_candle // ATR Calculation atr_length = 20 atr = ta.atr(atr_length) // SL & TP Multipliers sl_multiplier = 1.3 // Stop-Loss Multiplier rr_ratio = 1.6 // Risk-Reward Ratio // Calculate Stop-Loss & Take-Profit levels dynamically sl_buy = close - (atr * sl_multiplier) tp_buy = close + (rr_ratio * (close - sl_buy)) sl_sell = close + (atr * sl_multiplier) tp_sell = close - (rr_ratio * (sl_sell - close)) // Candlestick Pattern Functions // morning_star = close[2] < open[2] and close[1] < open[1] and close > open and close > close[2] pin_bar_bullish = close > open and (high - math.max(open, close)) > 2 * (open - close) and (math.min(open, close) - low) > 2 * (open - close) // bullish_engulfing = close > open and open[1] > close[1] and open < close[1] and close > open[1] inverted_hammer = close > open and (high - low) > 3 * (open - close) and (high - close) < 0.1 * (high - low) // evening_star = close[2] > open[2] and close[1] > open[1] and close < open and close < close[2] pin_bar_bearish = open > close and (high - math.max(open, close)) > 2 * (open - close) and (math.min(open, close) - low) > 2 * (open - close) // bearish_engulfing = open > close and close[1] > open[1] and close < open[1] and open > close[1] hanging_man = open > close and (high - low) > 3 * (open - close) and (open - low) < 0.1 * (high - low) // Pattern-based Bullish & Bearish Signals bullish_signal = uptrend and (pin_bar_bullish or bullish_engulfing or inverted_hammer) bearish_signal = downtrend and (pin_bar_bearish or bearish_engulfing or hanging_man) // Final Buy & Sell Signal Conditions (Only Trade in Strong Trends) raw_buy_signal = buy_signal_from_hh_hl or bullish_signal raw_sell_signal = sell_signal_from_lh_ll or bearish_signal // Tracking Previous Signal Type var int prev_signal = 0 // 1 for buy, -1 for sell, 0 for none // Buy/Sell Counters var int buy_count = 0 var int sell_count = 0 buy_signal = false sell_signal = false if raw_buy_signal if prev_signal != 1 // Reset when switching from sell to buy buy_count := 0 buy_count := buy_count + 1 buy_signal := (buy_count % 10 == 1 or buy_count % 10 == 5) // Show only 1st and 5th signal in each set of 10 prev_signal := 1 // Track the last signal type if raw_sell_signal if prev_signal != -1 // Reset when switching from buy to sell sell_count := 0 sell_count := sell_count + 1 sell_signal := (sell_count % 10 == 1 or sell_count % 10 == 5) // Show only 1st and 5th signal in each set of 10 prev_signal := -1 // Track the last signal type // // Strategy Entries and Exits // if raw_buy_signal // strategy.entry("Buy", strategy.long) // strategy.exit("TP/SL Buy", from_entry="Buy", stop=sl_buy, limit=tp_buy) // if raw_sell_signal // strategy.entry("Sell", strategy.short) // strategy.exit("TP/SL Sell", from_entry="Sell", stop=sl_sell, limit=tp_sell) // Plot User-defined EMAs (For visualization only) plot(user_ema1, color=color.blue, linewidth=2, title="EMA 1") plot(user_ema2, color=color.purple, linewidth=2, title="EMA 2") plot(user_ema3, color=color.gray, linewidth=2, title="User EMA 3") // Plot Buy/Sell Signals plotshape(series=buy_signal, location=location.belowbar, color=color.green, style=shape.labelup, title="Buy Signal", text="BUY") plotshape(series=sell_signal, location=location.abovebar, color=color.red, style=shape.labeldown, title="Sell Signal", text="SELL") // Draw SL & TP as Small Horizontal Lines if buy_signal line.new(x1=bar_index, y1=sl_buy, x2=bar_index + 5, y2=sl_buy, width=2, color=color.red, style=line.style_dotted) line.new(x1=bar_index, y1=tp_buy, x2=bar_index + 5, y2=tp_buy, width=2, color=color.green, style=line.style_dotted) if sell_signal line.new(x1=bar_index, y1=sl_sell, x2=bar_index + 5, y2=sl_sell, width=2, color=color.red, style=line.style_dotted) line.new(x1=bar_index, y1=tp_sell, x2=bar_index + 5, y2=tp_sell, width=2, color=color.green, style=line.style_dotted) // Alerts for Buy/Sell Signals alertcondition(buy_signal, title="Buy Signal Alert", message="BUY: Higher High & Higher Low formed + EMA Uptrend Confirmation") alertcondition(sell_signal, title="Sell Signal Alert", message="SELL: Lower High & Lower Low formed + EMA Downtrend Confirmation")
📋 Copy Code
🚀 Advanced Indicator for Major & Volatile Pairs
//@version=5 indicator("Enhanced Buy/Sell limited signals with SL & TP", overlay=true) ema1_length = input.int(9, title="EMA 1 Length", minval=1) ema2_length = input.int(15, title="EMA 2 Length", minval=1) ema3_length = input.int(34, title="EMA 3 Length", minval=1) user_ema1 = ta.ema(close, ema1_length) user_ema2 = ta.ema(close, ema2_length) user_ema3 = ta.ema(close, ema3_length) // Define the EMAs ema9 = ta.ema(close, 9) ema15 = ta.ema(close, 15) // Calculate the slope of the EMAs (approximate trend angle) slope_ema9 = math.atan((ema9 - ema9[1]) / 1) * (180 / math.pi) slope_ema15 = math.atan((ema15 - ema15[1]) / 1) * (180 / math.pi) // Define the minimum slope for trend confirmation (30 degrees) min_slope = 30 // Trend Conditions Based on EMA Slopes uptrend = ema9 > ema15 and slope_ema9 > min_slope and slope_ema15 > min_slope downtrend = ema9 < ema15 and slope_ema9 < -min_slope and slope_ema15 < -min_slope // Define Bullish and Bearish Candles bullish_candle = close > open bearish_candle = close < open // Higher High & Higher Low (Uptrend) higher_high = high > high[1] and high[1] > high[2] higher_low = low > low[1] and low[1] > low[2] // Lower High & Lower Low (Downtrend) lower_high = high < high[1] and high[1] < high[2] lower_low = low < low[1] and low[1] < low[2] // Buy signal when market forms HH & HL + bullish trend + bullish candle (Only in Uptrend) buy_signal_from_hh_hl = uptrend and higher_high and higher_low and bullish_candle // Sell signal when market forms LH & LL + bearish trend + bearish candle (Only in Downtrend) sell_signal_from_lh_ll = downtrend and lower_high and lower_low and bearish_candle // ATR Calculation atr_length = 20 atr = ta.atr(atr_length) // SL & TP Multipliers sl_multiplier = 1.3 // Stop-Loss Multiplier rr_ratio = 1.6 // Risk-Reward Ratio // Calculate Stop-Loss & Take-Profit levels dynamically sl_buy = close - (atr * sl_multiplier) tp_buy = close + (rr_ratio * (close - sl_buy)) sl_sell = close + (atr * sl_multiplier) tp_sell = close - (rr_ratio * (sl_sell - close)) // Candlestick Pattern Functions morning_star = close[2] < open[2] and close[1] < open[1] and close > open and close > close[2] pin_bar_bullish = close > open and (high - math.max(open, close)) > 2 * (open - close) and (math.min(open, close) - low) > 2 * (open - close) bullish_engulfing = close > open and open[1] > close[1] and open < close[1] and close > open[1] inverted_hammer = close > open and (high - low) > 3 * (open - close) and (high - close) < 0.1 * (high - low) evening_star = close[2] > open[2] and close[1] > open[1] and close < open and close < close[2] pin_bar_bearish = open > close and (high - math.max(open, close)) > 2 * (open - close) and (math.min(open, close) - low) > 2 * (open - close) bearish_engulfing = open > close and close[1] > open[1] and close < open[1] and open > close[1] hanging_man = open > close and (high - low) > 3 * (open - close) and (open - low) < 0.1 * (high - low) // Pattern-based Bullish & Bearish Signals bullish_signal = uptrend and (morning_star or pin_bar_bullish or bullish_engulfing or inverted_hammer) bearish_signal = downtrend and (evening_star or pin_bar_bearish or bearish_engulfing or hanging_man) // Final Buy & Sell Signal Conditions (Only Trade in Strong Trends) raw_buy_signal = buy_signal_from_hh_hl or bullish_signal raw_sell_signal = sell_signal_from_lh_ll or bearish_signal // Tracking Previous Signal Type var int prev_signal = 0 // 1 for buy, -1 for sell, 0 for none // Buy/Sell Counters var int buy_count = 0 var int sell_count = 0 buy_signal = false sell_signal = false if raw_buy_signal if prev_signal != 1 // Reset when switching from sell to buy buy_count := 0 buy_count := buy_count + 1 buy_signal := (buy_count % 10 == 1 or buy_count % 10 == 5) // Show only 1st and 5th signal in each set of 10 prev_signal := 1 // Track the last signal type if raw_sell_signal if prev_signal != -1 // Reset when switching from buy to sell sell_count := 0 sell_count := sell_count + 1 sell_signal := (sell_count % 10 == 1 or sell_count % 10 == 5) // Show only 1st and 5th signal in each set of 10 prev_signal := -1 // Track the last signal type // // Execute Trades // if buy_signal // strategy.entry("Long", strategy.long, comment="BUY Signal", limit=close) // strategy.exit("TP/SL Long", from_entry="Long", limit=tp_buy, stop=sl_buy) // if sell_signal // strategy.entry("Short", strategy.short, comment="SELL Signal", limit=close) // strategy.exit("TP/SL Short", from_entry="Short", limit=tp_sell, stop=sl_sell) // Plot User-defined EMAs (For visualization only) plot(user_ema1, color=color.blue, linewidth=2, title="EMA 1") plot(user_ema2, color=color.purple, linewidth=2, title="EMA 2") plot(user_ema3, color=color.gray, linewidth=2, title="User EMA 3") // Plot Buy/Sell Signals plotshape(series=buy_signal, location=location.belowbar, color=color.green, style=shape.labelup, title="Buy Signal", text="BUY") plotshape(series=sell_signal, location=location.abovebar, color=color.red, style=shape.labeldown, title="Sell Signal", text="SELL") // Draw SL & TP as Small Horizontal Lines if buy_signal line.new(x1=bar_index, y1=sl_buy, x2=bar_index + 5, y2=sl_buy, width=2, color=color.red, style=line.style_dotted) line.new(x1=bar_index, y1=tp_buy, x2=bar_index + 5, y2=tp_buy, width=2, color=color.green, style=line.style_dotted) if sell_signal line.new(x1=bar_index, y1=sl_sell, x2=bar_index + 5, y2=sl_sell, width=2, color=color.red, style=line.style_dotted) line.new(x1=bar_index, y1=tp_sell, x2=bar_index + 5, y2=tp_sell, width=2, color=color.green, style=line.style_dotted) // Alerts for Buy/Sell Signals alertcondition(buy_signal, title="Buy Signal Alert", message="BUY: Higher High & Higher Low formed + EMA Uptrend Confirmation") alertcondition(sell_signal, title="Sell Signal Alert", message="SELL: Lower High & Lower Low formed + EMA Downtrend Confirmation")
📋 Copy Code
📘 Instructions before using the Indicator
✅
Take trade only when 9 and 15 EMA are trending upwards/downwards.
✅
Trade only on trending markets.
✅
Wait for clean signals with strong candle confirmation.
✅
Combine with support/resistance or EMA for better accuracy.
✅
Risk management is key: maintain ≥1:2 RR, always use stop-loss.
❌
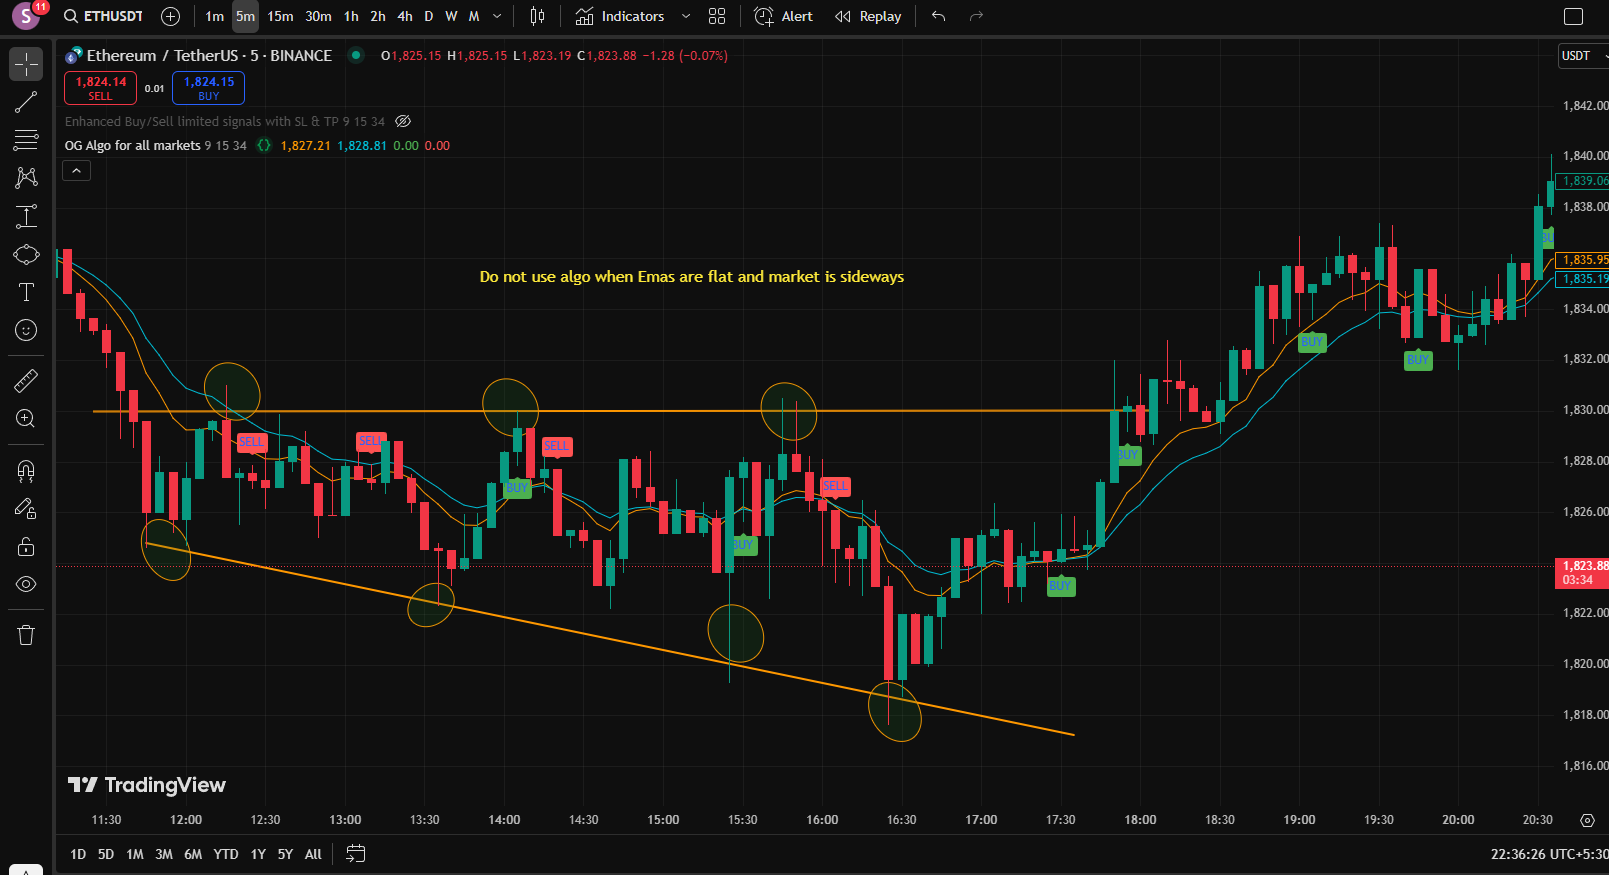
No trades when EMAs are flat (sideways market).
❌
Avoid signals generated on very large candles (high noise).
❌
Don’t trade blindly — always confirm with market structure.
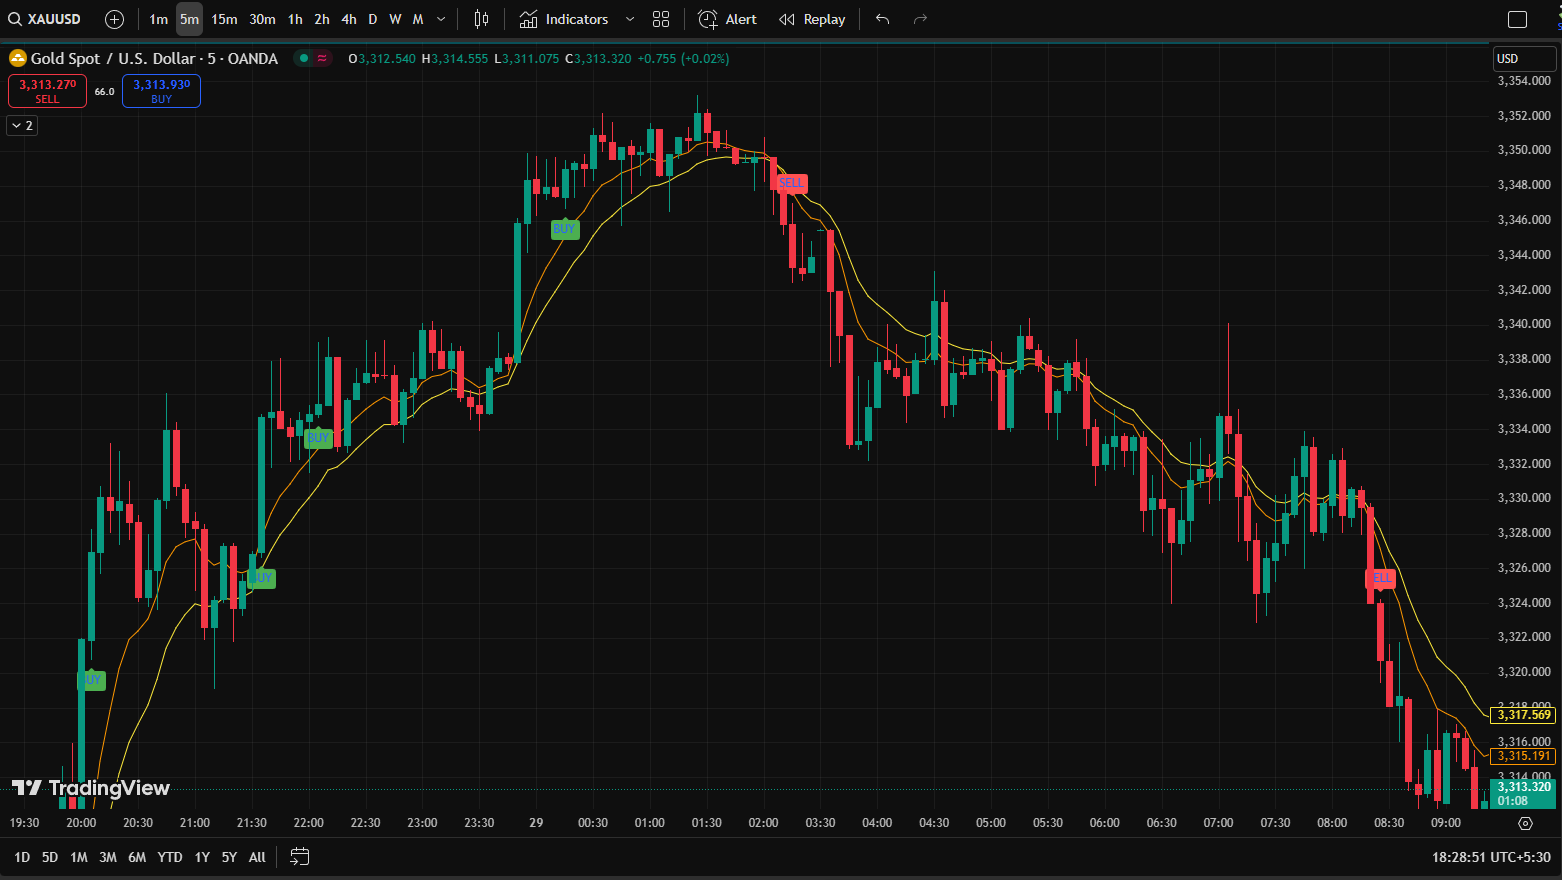
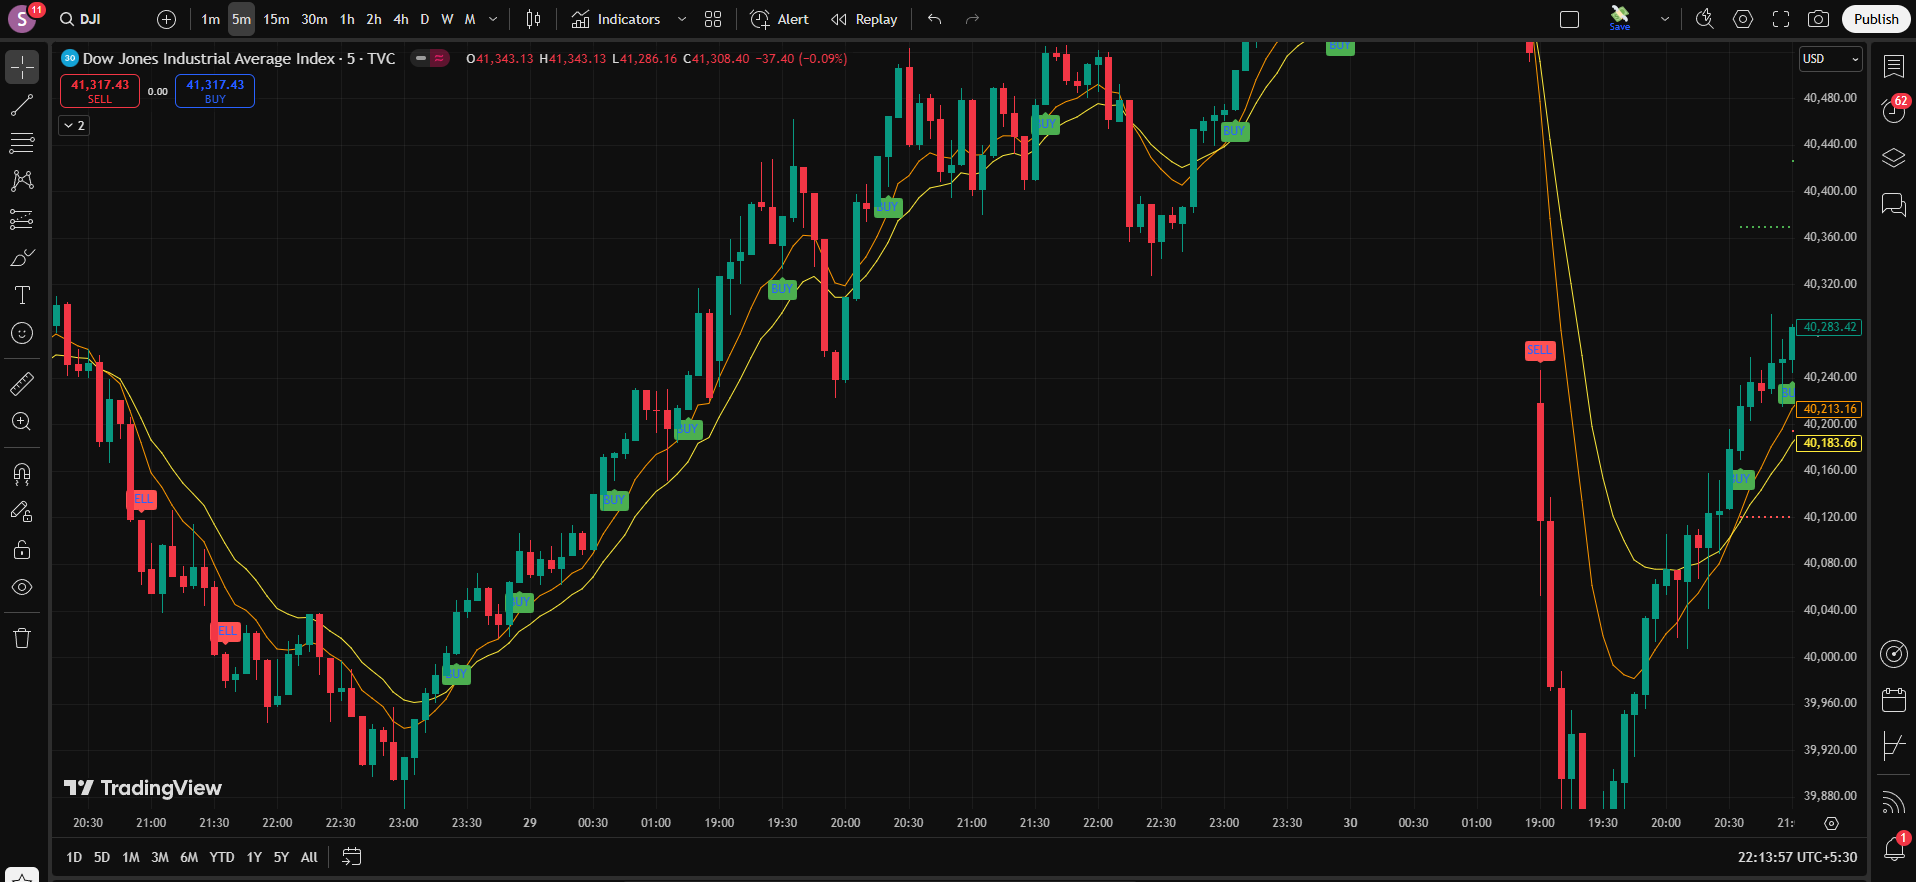
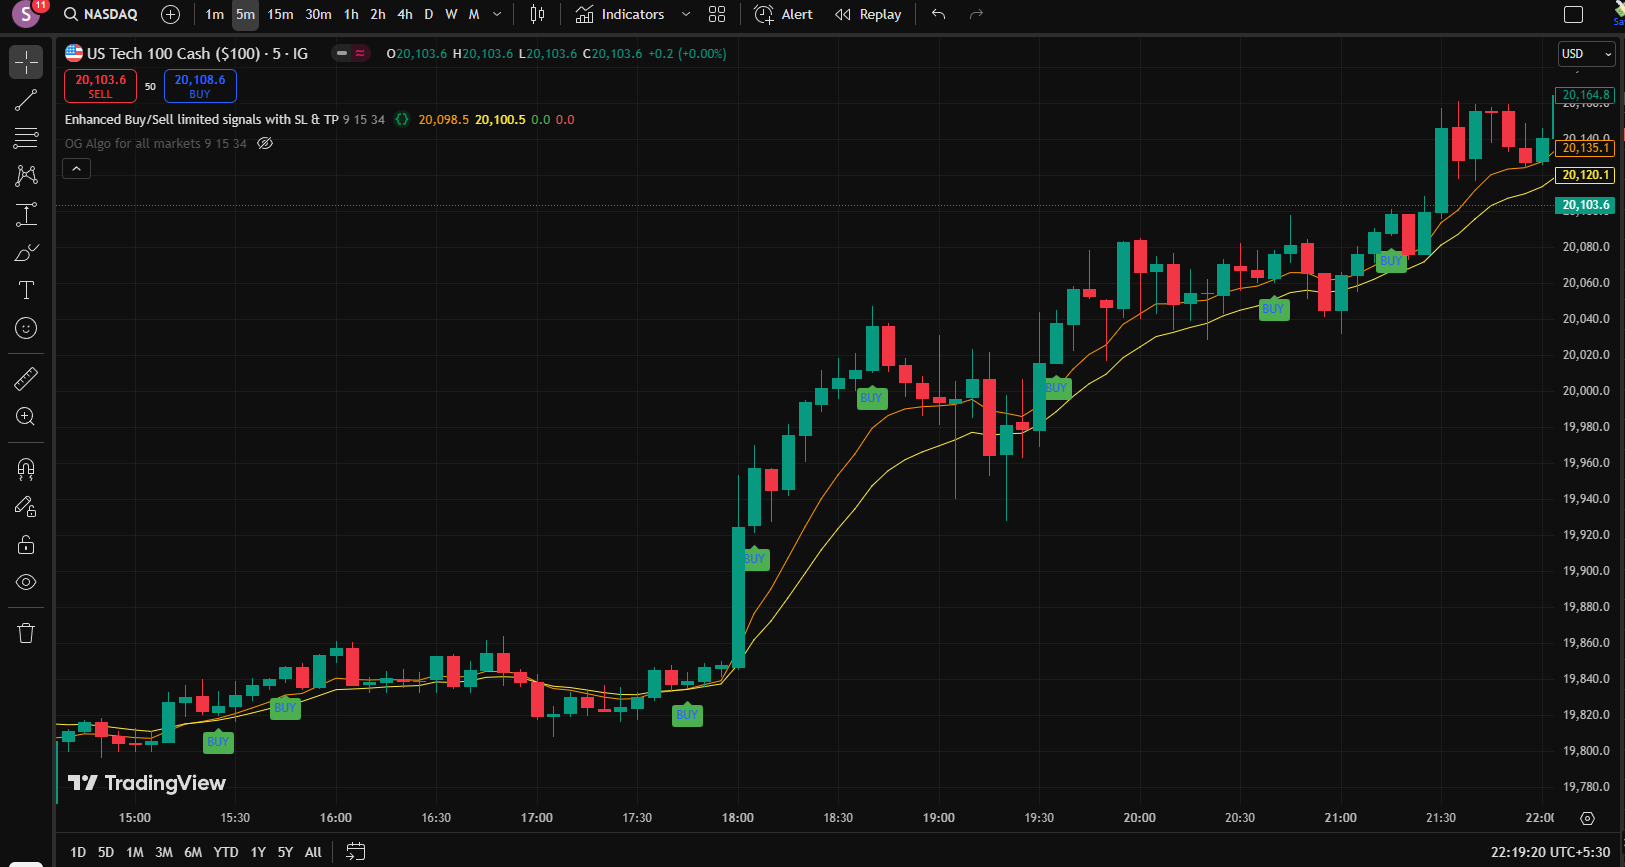
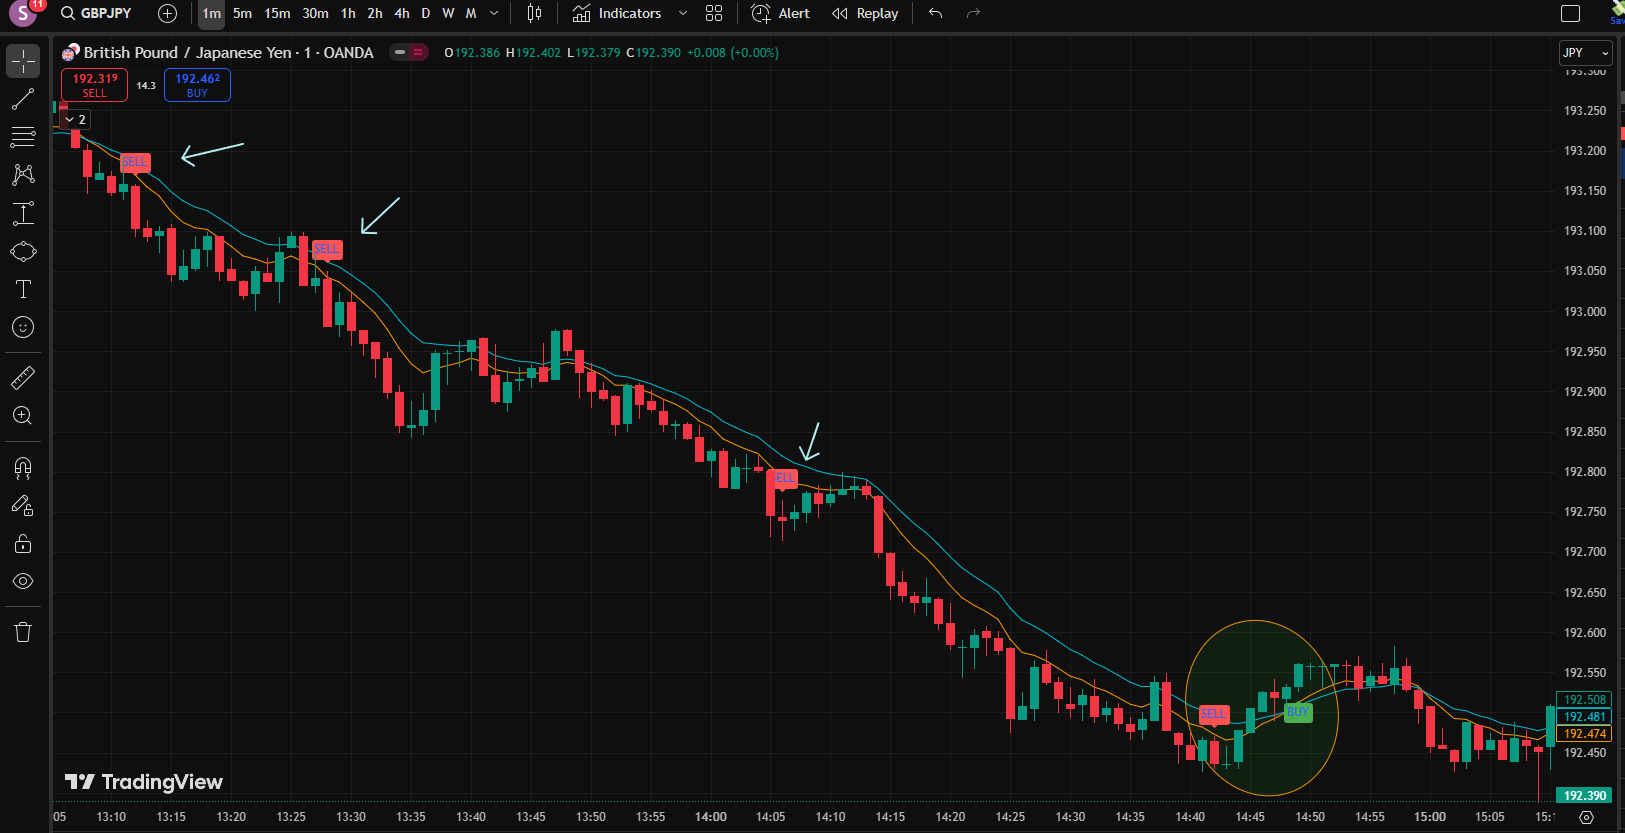
📸 Indicator Results (Real Market Examples)
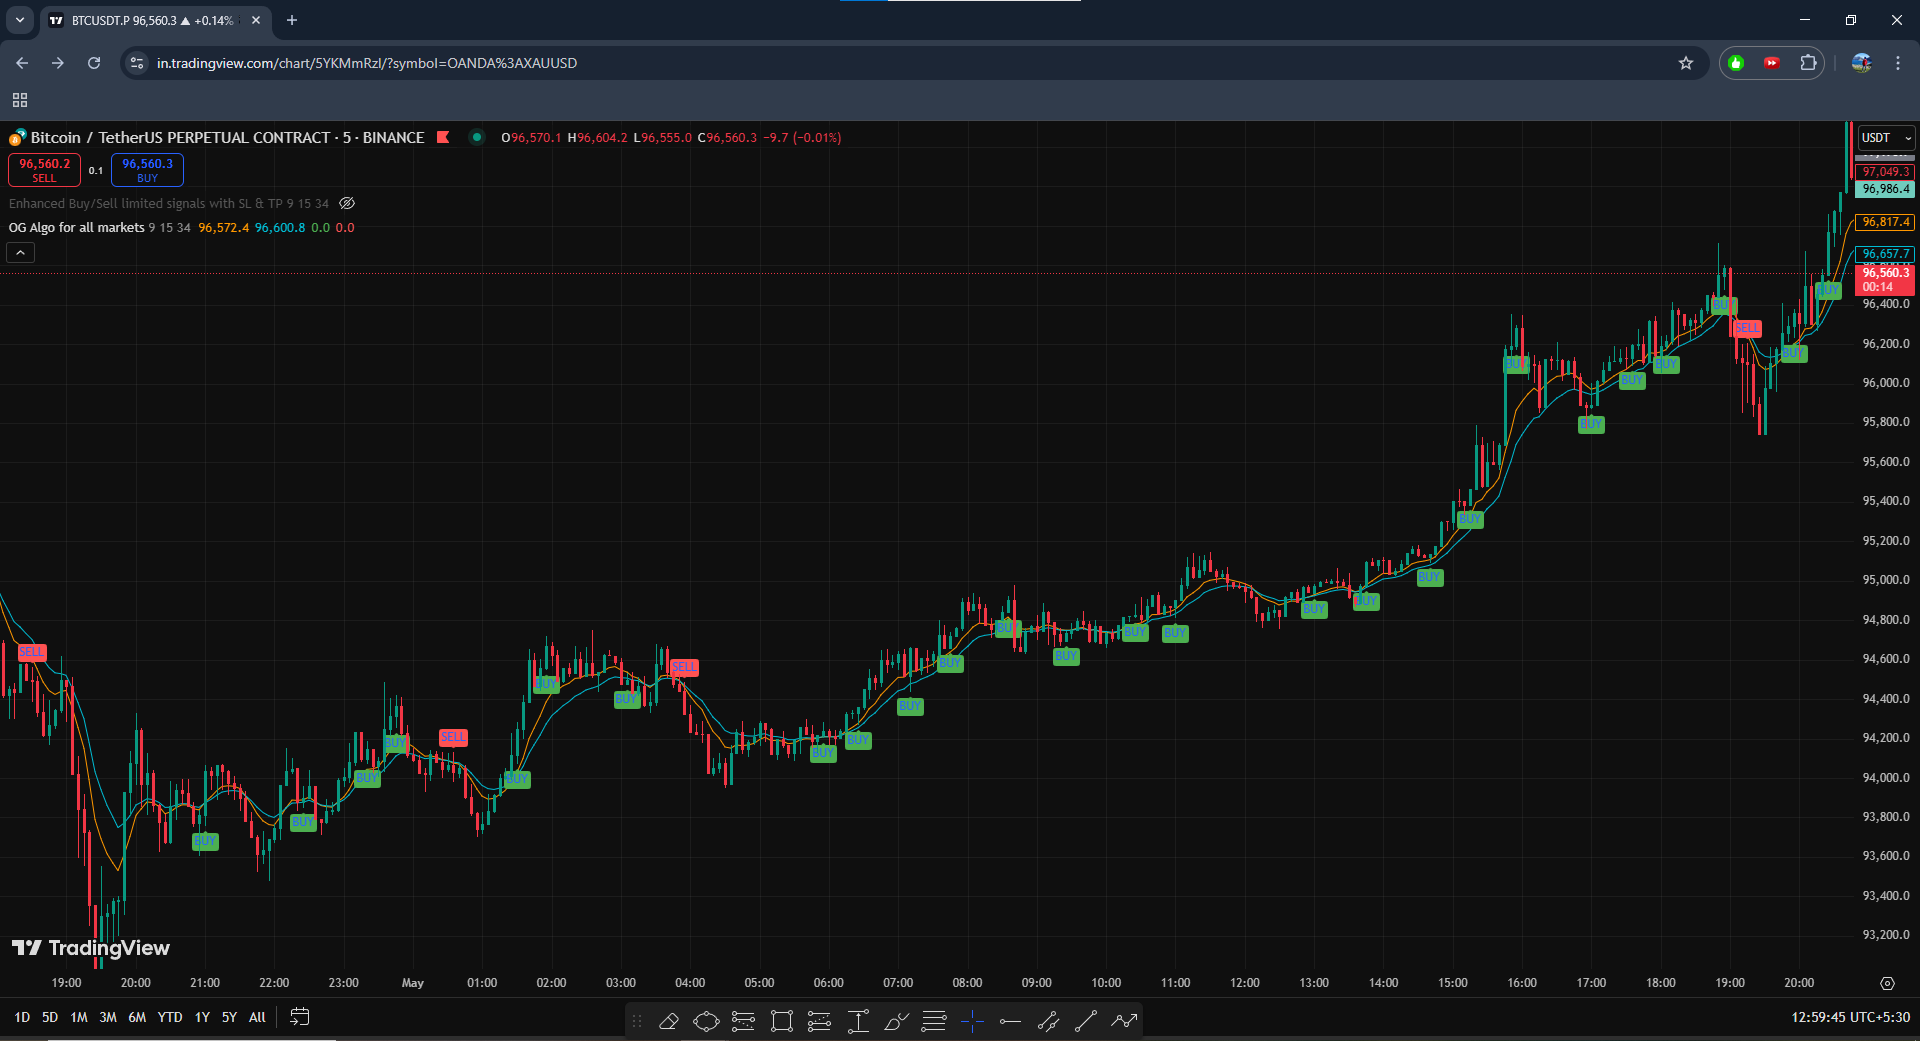
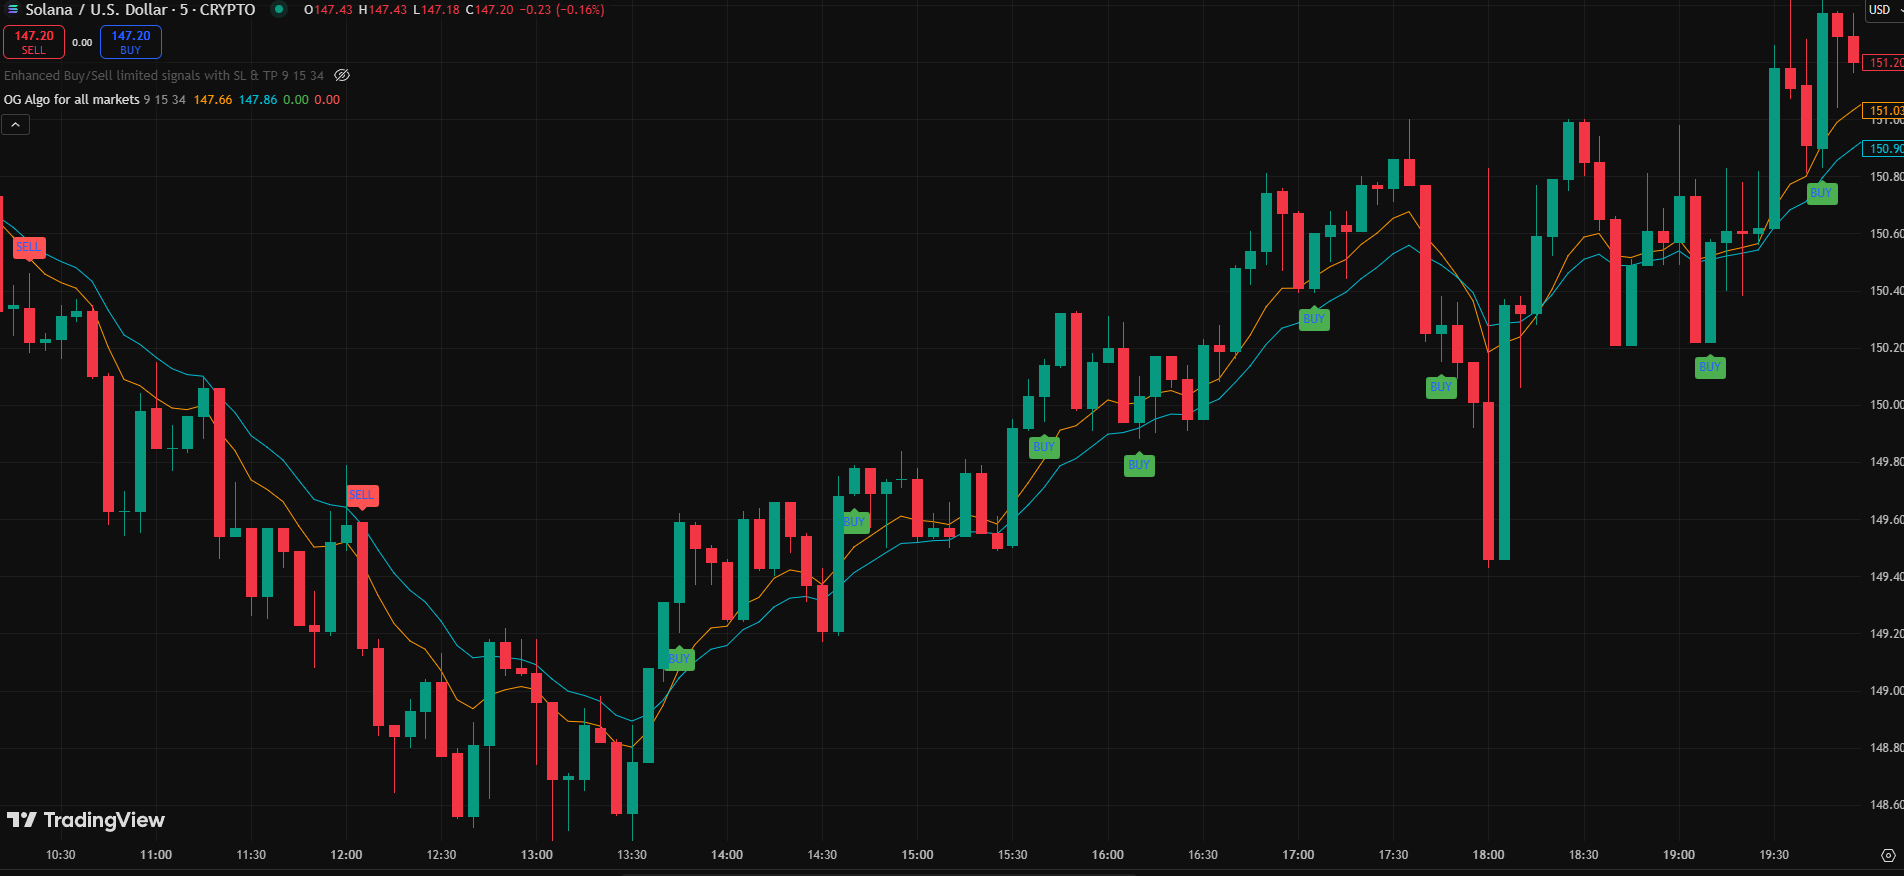
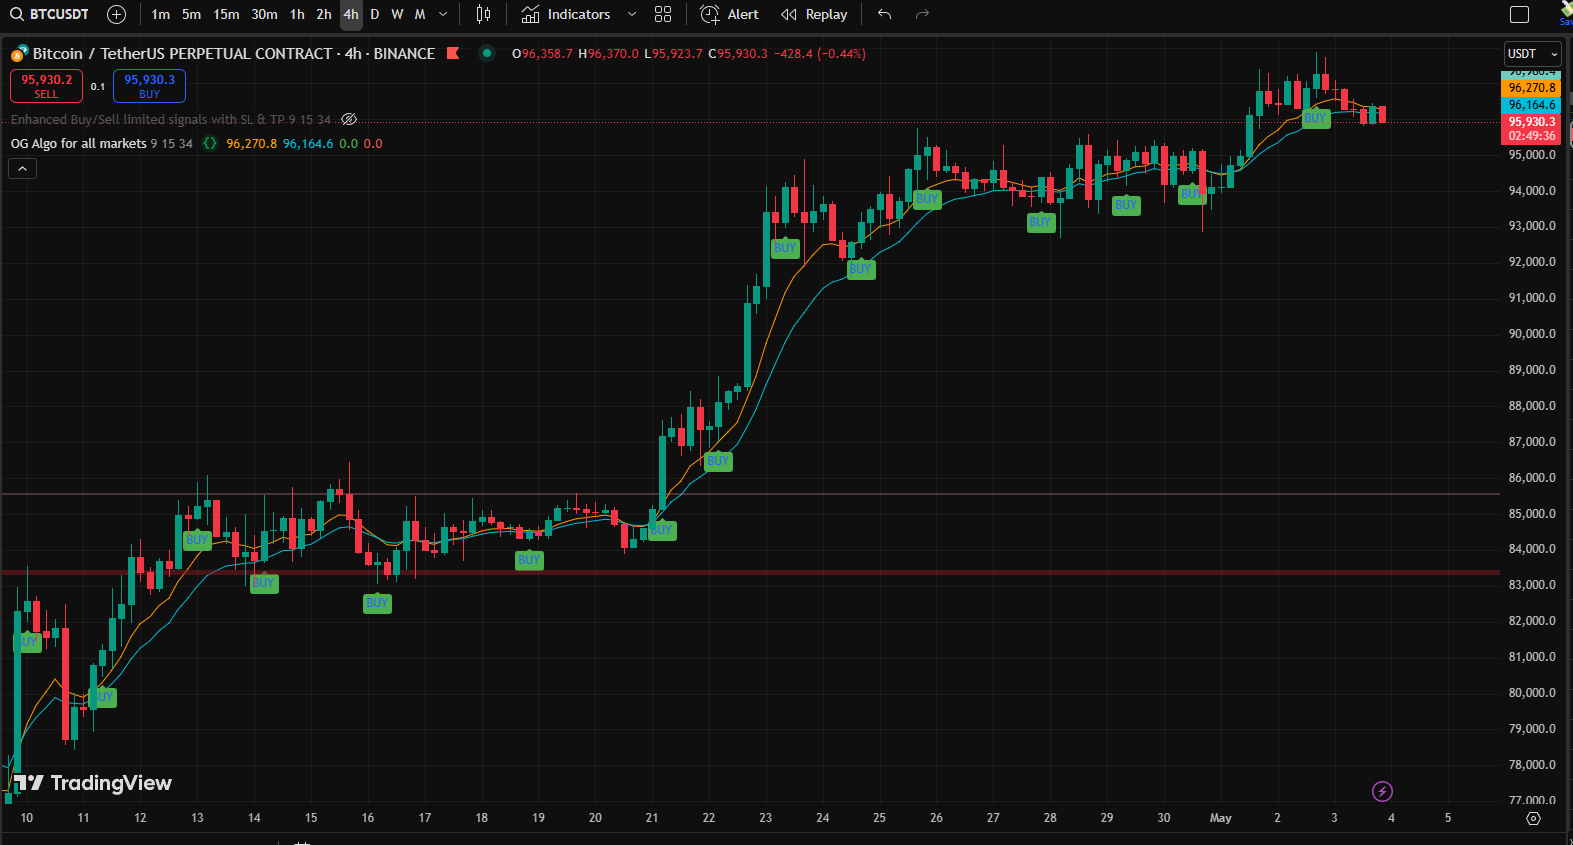
🚀 Crypto Market Results
💱 Forex Market Results
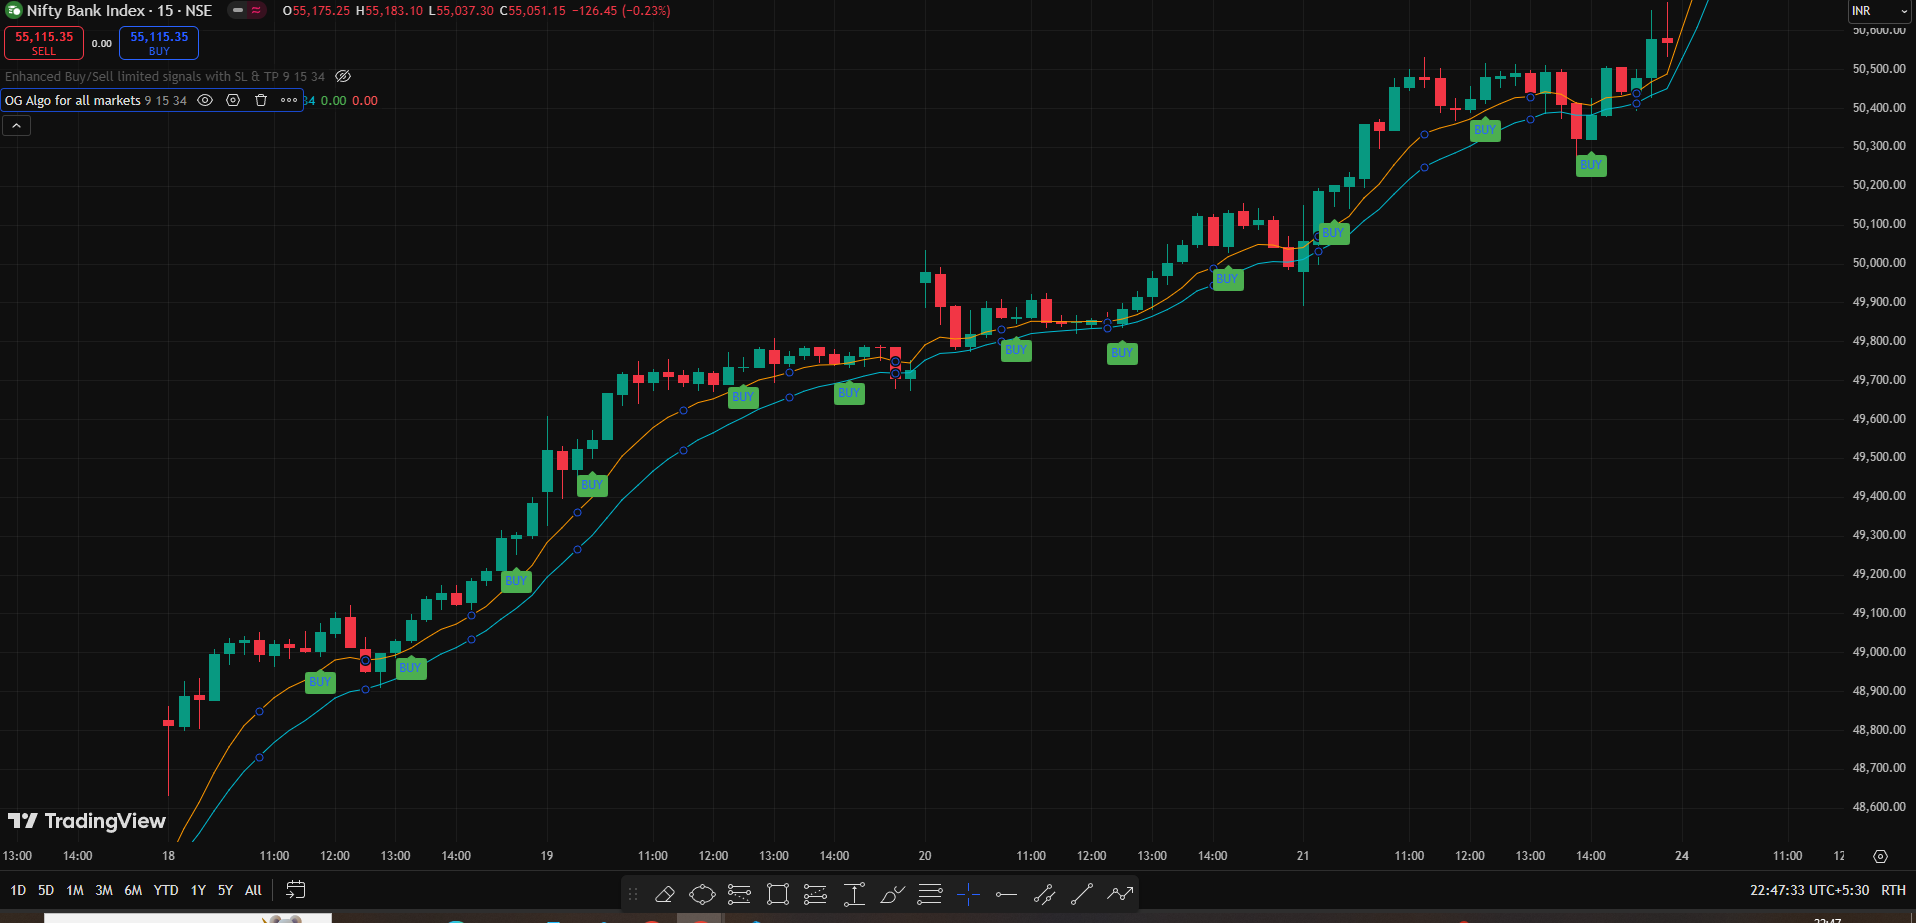
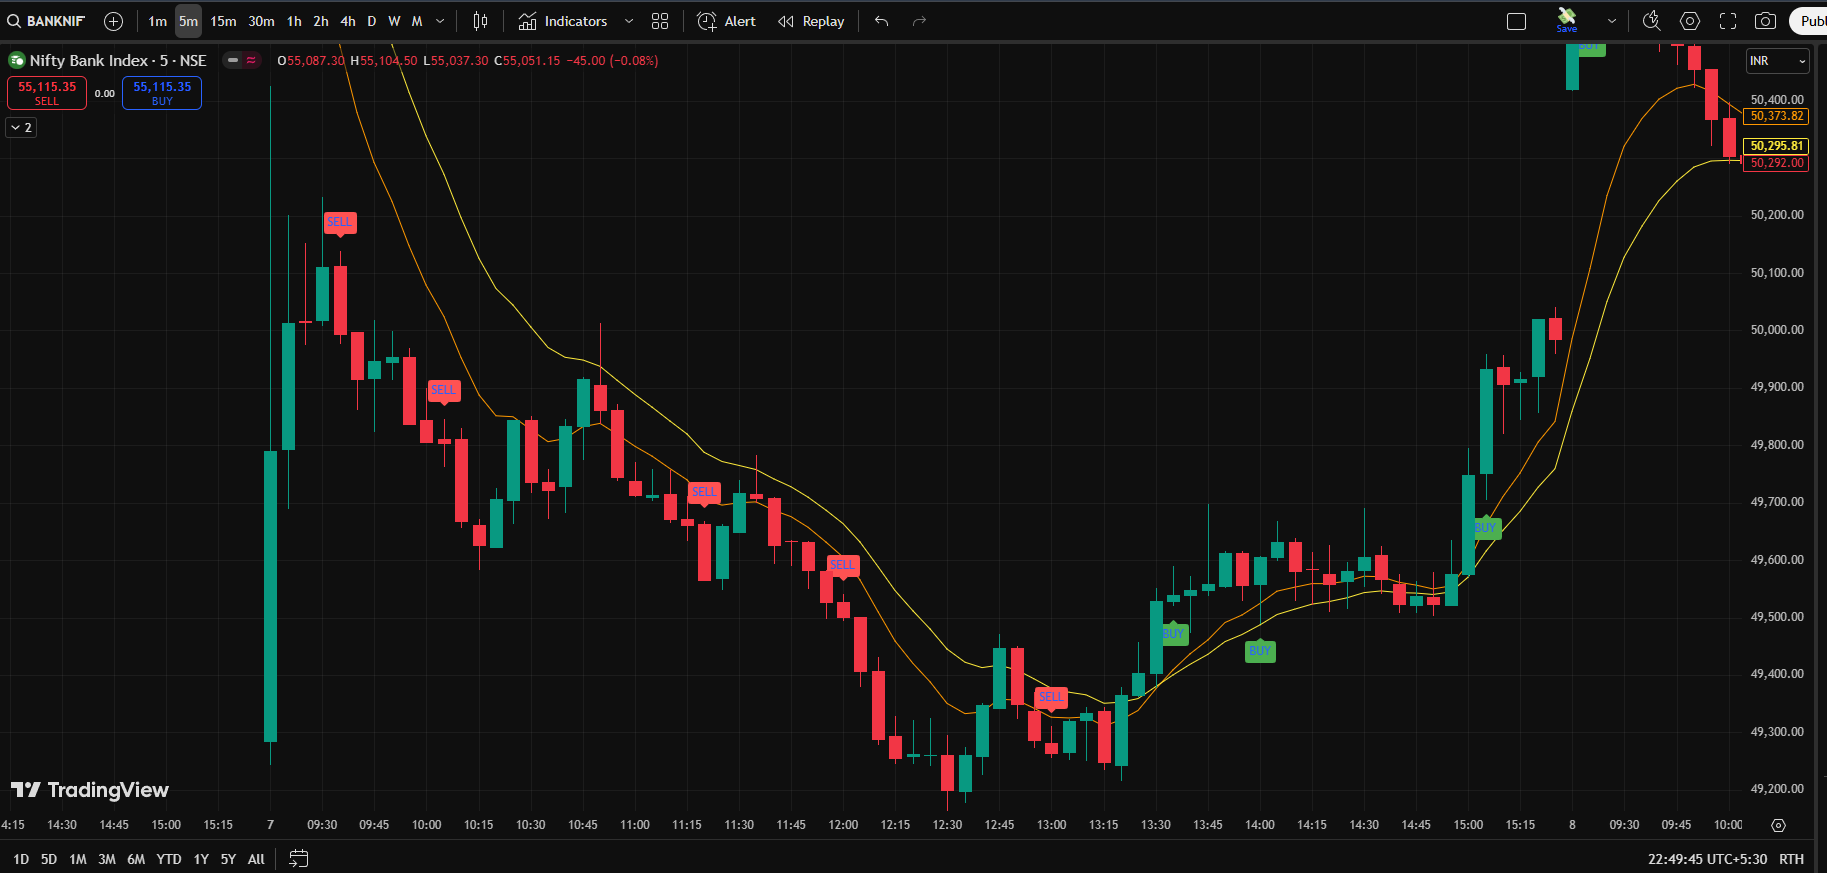
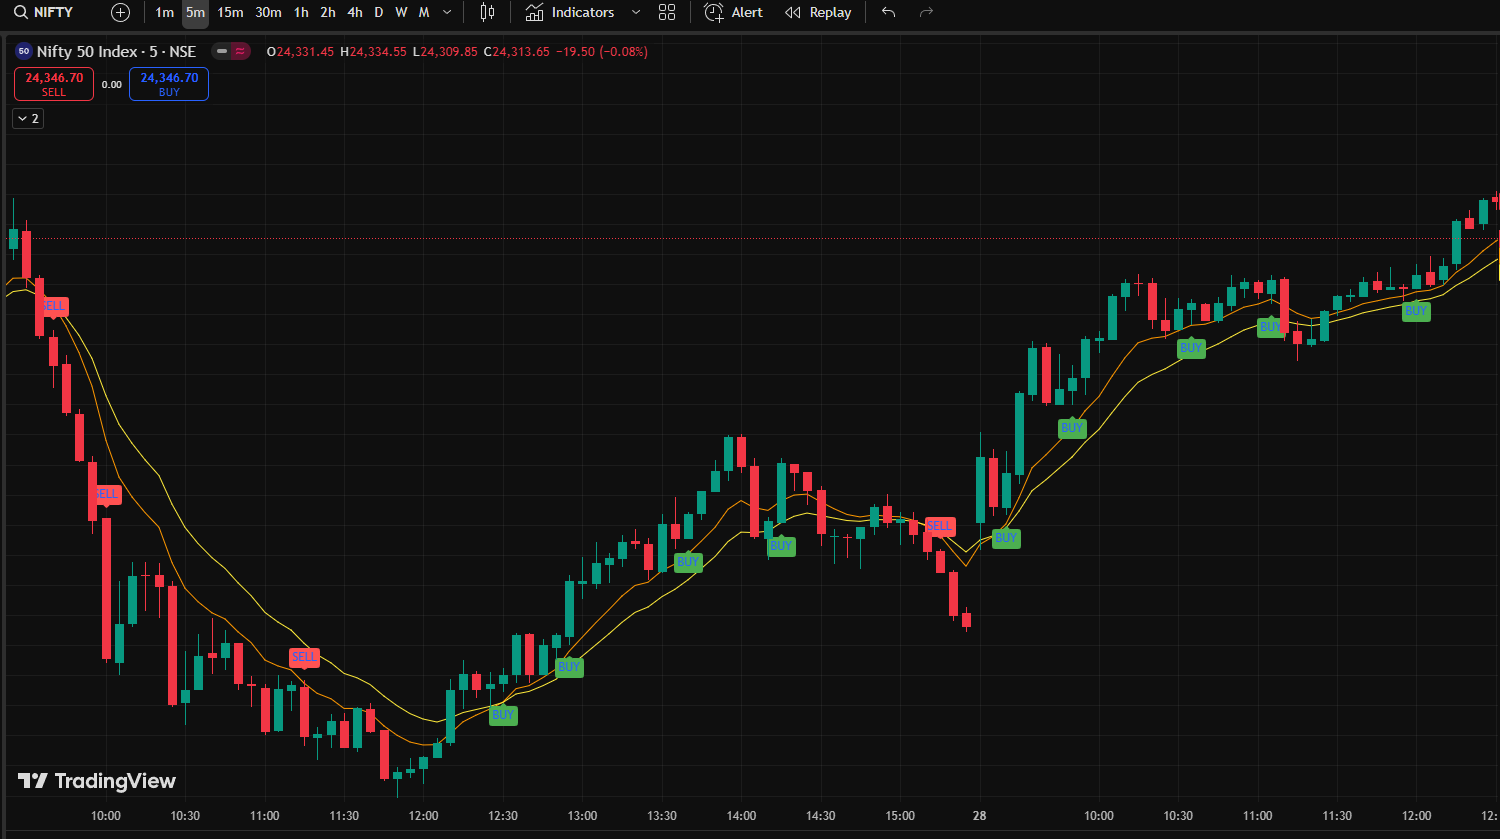
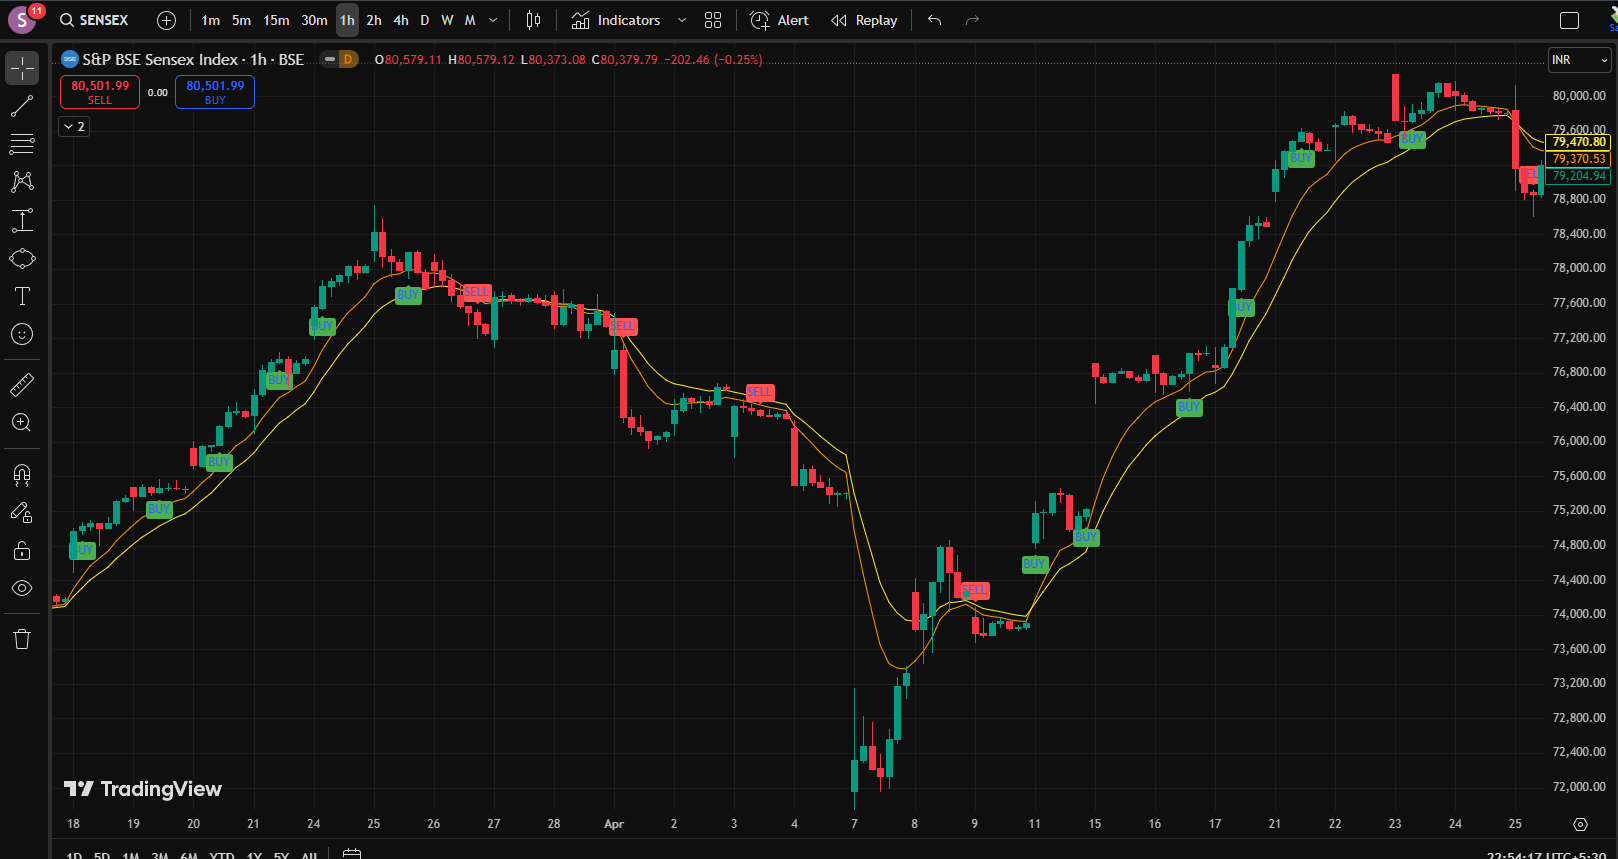
🇮🇳 Indian Market Results