📊 Price Action & Indicators
In this milestone, we’ll explore how to analyze market behavior through price action and how to complement it using technical indicators. These are essential skills for traders aiming to make sense of charts without relying too much on guesswork.
📌 Price Action
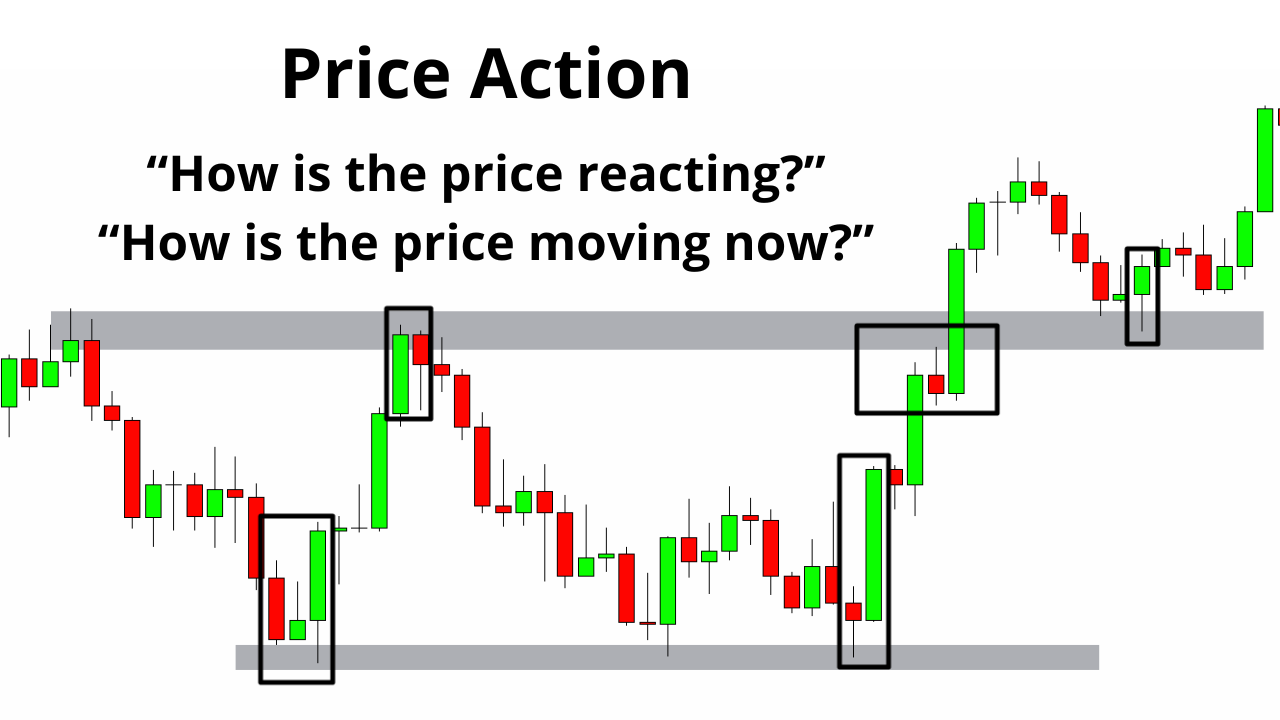
Price action refers to analyzing the movement of price over time — without relying on indicators. It is based on reading raw market data through chart structures, patterns, and candlesticks to predict future moves.
Price action helps traders spot key levels of support/resistance, trend direction, and market sentiment. It’s widely used for its clarity and directness — what you see is what you get.
- High Precision: Allows entry at logical areas like breakouts, pullbacks, or rejections.
- No Lag: Unlike indicators, price action reflects real-time price behavior.
- Universally Applicable: Works across Forex, stocks, crypto, and commodities.
Candlestick Psychology
Every candlestick tells a story about the battle between buyers and sellers. Candlestick psychology reveals how price is accepted or rejected during a trading session. Size, wick, and position of the candle reveal the emotional dynamics of the market.
- Long bodies = strong conviction (buying or selling).
- Long wicks = price rejection at extremes (potential reversal signals).
- Small bodies = indecision (market is unsure about next direction).
What are Bullish and Bearish Patterns?
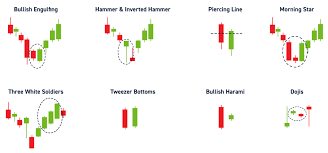
Bullish patterns are formations on the chart that suggest buyers are gaining strength and that price may rise. These usually form after a downtrend and signal a reversal or continuation upward.
Bearish patterns indicate seller dominance, often appearing after an uptrend, suggesting the price could drop. They warn traders of weakening buying pressure.
Examples of Bullish Patterns:
- Bullish Engulfing
- Hammer
- Morning Star
Examples of Bearish Patterns:
- Bearish Engulfing
- Shooting Star
- Evening Star
📈 Technical Indicators
Indicators are mathematical formulas or visual overlays applied to price and volume. Their primary purpose is to help traders identify trends, measure momentum, confirm price patterns, and spot entry/exit signals. Indicators are helpful for objective decision-making, especially when price action is unclear.
Most common indicators used by traders:
- RSI (Relative Strength Index): Shows whether an asset is overbought (>70) or oversold (<30).
- MACD (Moving Average Convergence Divergence): Helps identify momentum and trend direction using moving averages.
- EMA (Exponential Moving Average): Gives more weight to recent prices for faster trend signals.
- Volume: Measures strength of buying/selling activity. High volume often confirms breakouts or breakdowns.
- Bollinger Bands: Show volatility expansion/contraction. Useful for breakout or mean-reversion strategies.
📚 Want to explore more? ➡️ See full list of technical indicators