📉 Chart Patterns & Market Structure
Chart patterns and market structure help traders interpret price behavior and anticipate market moves. Understanding how patterns form and how structure shifts allows traders to time entries and exits more precisely.
🔁 Reversal Patterns
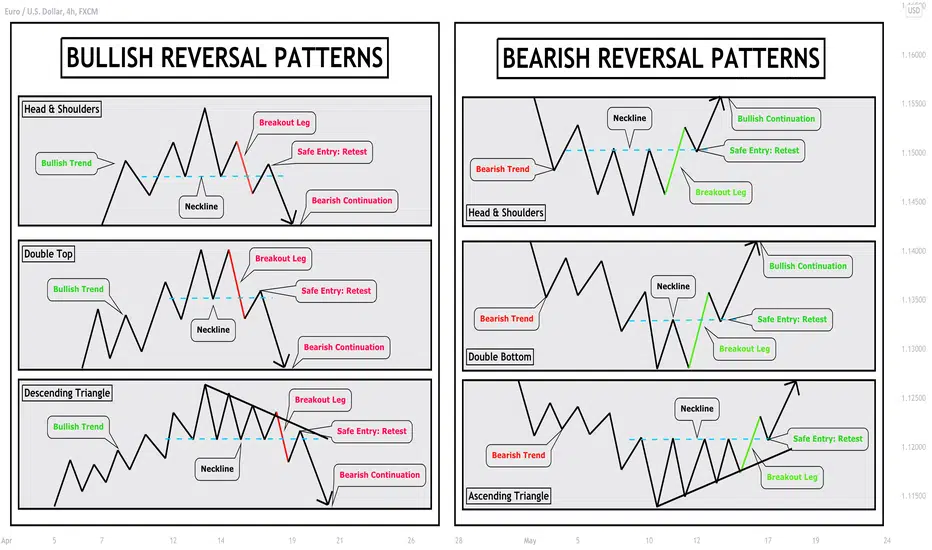
Reversal patterns indicate a possible change in the direction of the current trend. They are especially useful after strong bullish or bearish moves, helping traders anticipate turning points in the market.
Double Top: A bearish signal formed when price hits a similar high twice and fails to break higher, indicating resistance and a potential drop once the neckline is broken.
Double Bottom: A bullish signal showing two price lows at the same level, suggesting support. A breakout above the neckline typically confirms the reversal.
Head & Shoulders: Consists of a central peak (head) with two smaller peaks on either side (shoulders). It's a bearish reversal structure that often signals the end of an uptrend.
Inverse Head & Shoulders: A bullish version, indicating a reversal from downtrend to uptrend. It forms after a prolonged decline and signals upward momentum if the neckline breaks.
🔄 Continuation Patterns
Unlike reversals, continuation patterns suggest the prevailing trend is likely to continue after a brief consolidation or pause.
Flags: Short-term rectangles that slope opposite to the main trend. After a sharp move, price consolidates in a narrow range before continuing in the same direction.
Pennants: Small symmetrical triangles formed after strong price moves. They represent a balance between buyers and sellers, and usually result in a breakout in the original trend's direction.
These patterns provide low-risk entry opportunities during a trend.
💥 Breakout vs Consolidation Zones
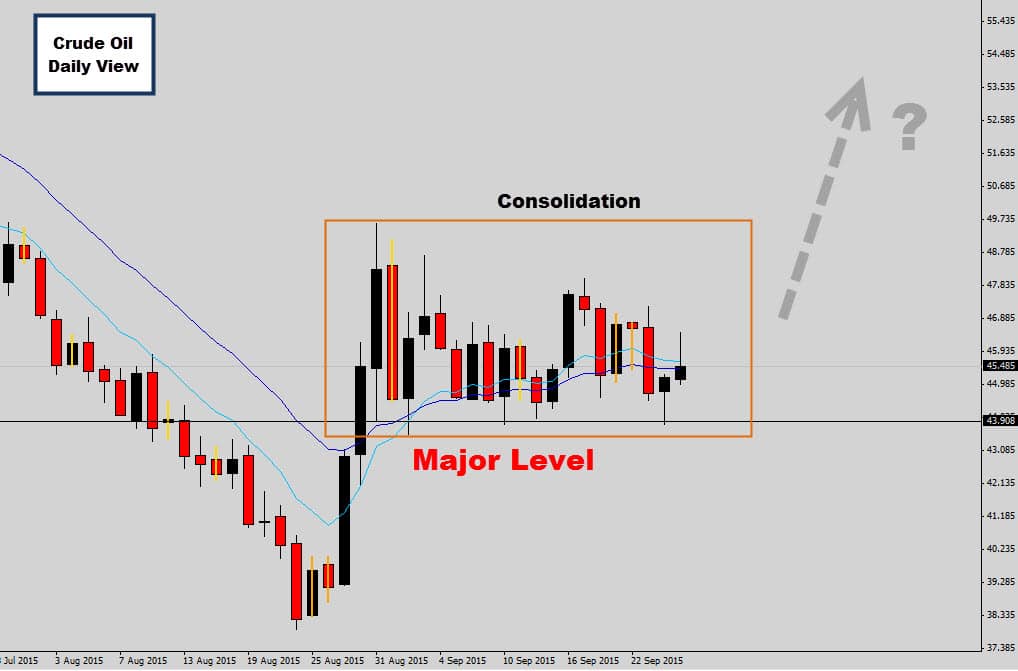
A consolidation zone is a range-bound area where the market trades sideways. This occurs when neither buyers nor sellers are in control. It typically precedes a strong directional move.
A breakout happens when the price breaches a defined support or resistance level with volume. Breakouts often mark the beginning of new trends and are crucial moments for momentum traders.
📊 What is Market Structure?
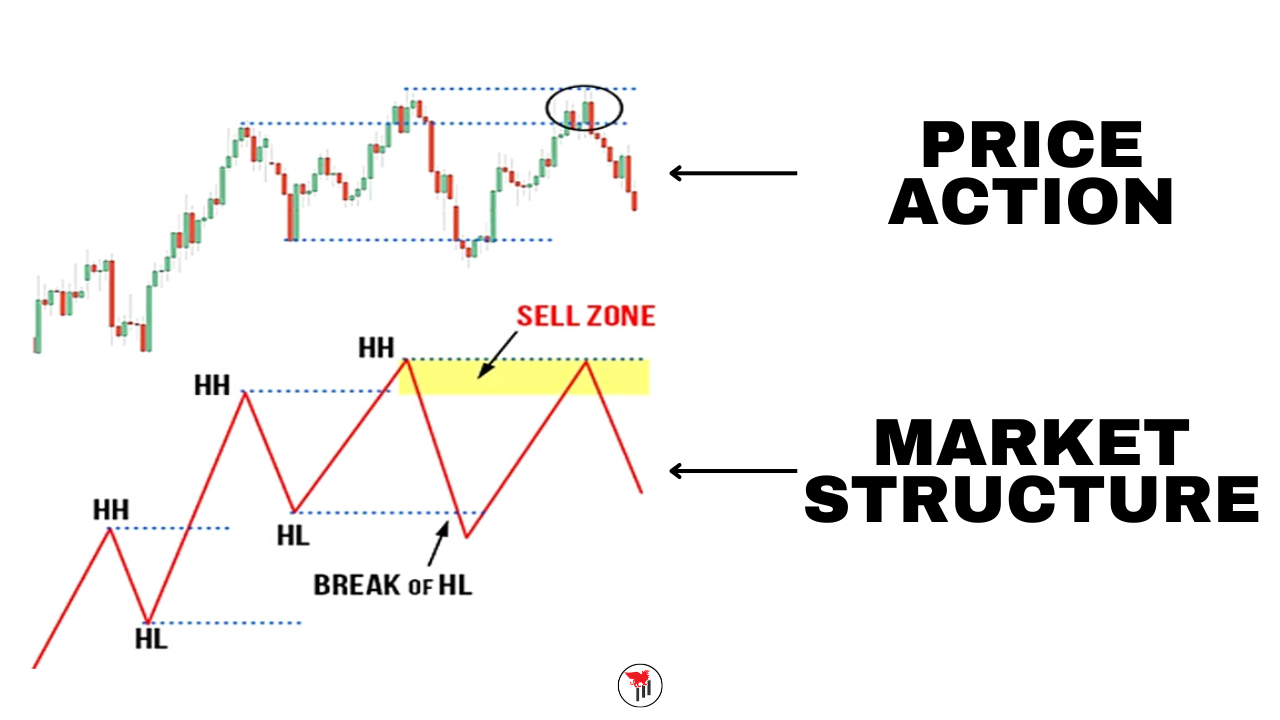
Market structure refers to the sequence of highs and lows that price forms over time. Recognizing this flow allows traders to stay aligned with the dominant trend.
Higher Highs and Higher Lows (HH/HL): These form a bullish market structure. Each high surpasses the previous, and each low is higher, showing increasing demand.
Lower Highs and Lower Lows (LH/LL): These form a bearish market structure. Each new peak and trough is lower than the last, indicating consistent downward pressure.
Break of Structure (BoS): This occurs when price fails to maintain the current sequence of highs or lows, signaling a potential reversal or transition phase.